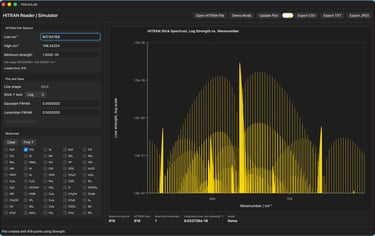
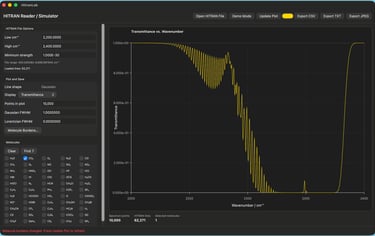
Screenshots showcasing a few of HitranLab's capabilities
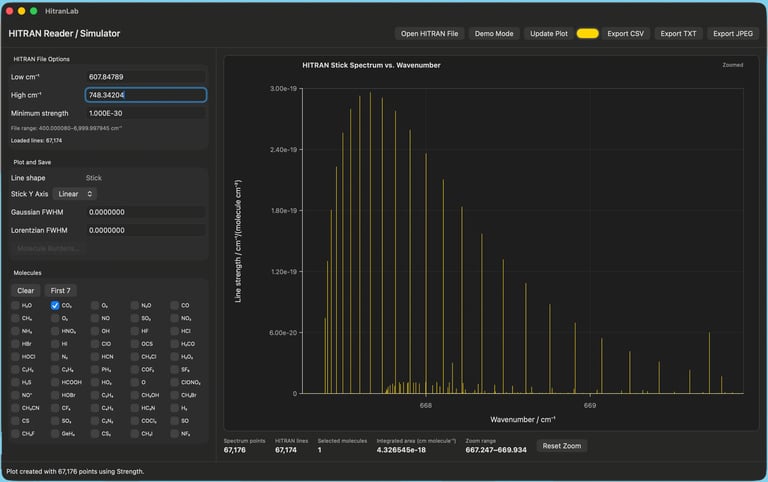
Linear plot of the stick-spectrum of CO₂in the v2, fundemental bending region.
Log plot of the stick-spectrum of CO₂ in the v2 region.
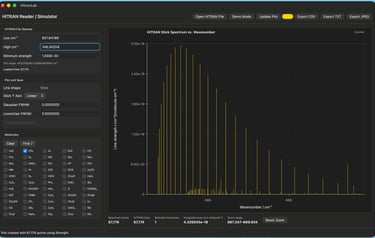
Zoomed in stick-spectrum of CO₂ Q-branch, in the v2 region.
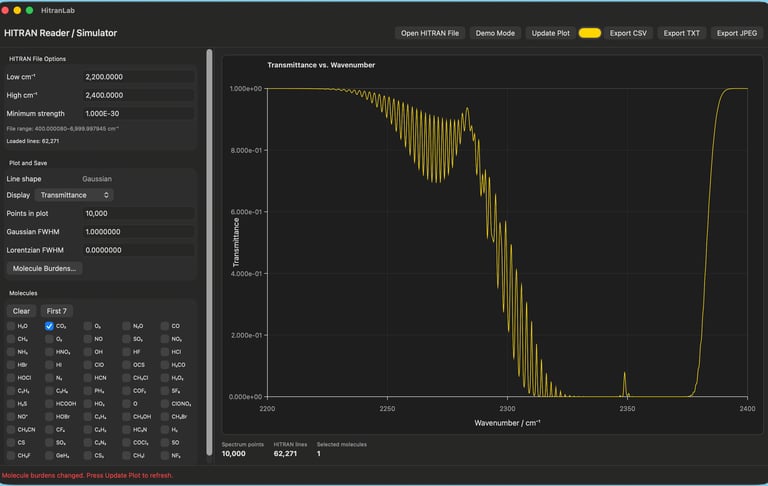
Simulated transmittance spectrum of CO₂ in the v2 region.
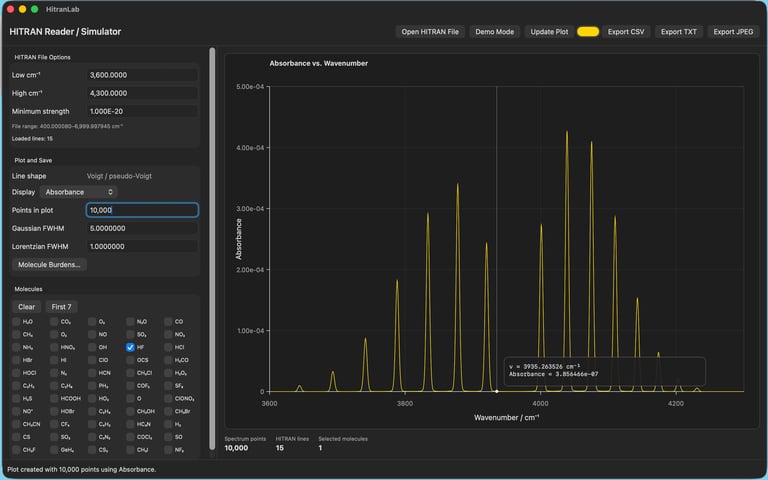
Simulated absorbance spectrum of HF using a 5-wavenumber Gaussian and a 1 wavenumber Lorentzian. In simulation mode, cursor reports position and absorbance.
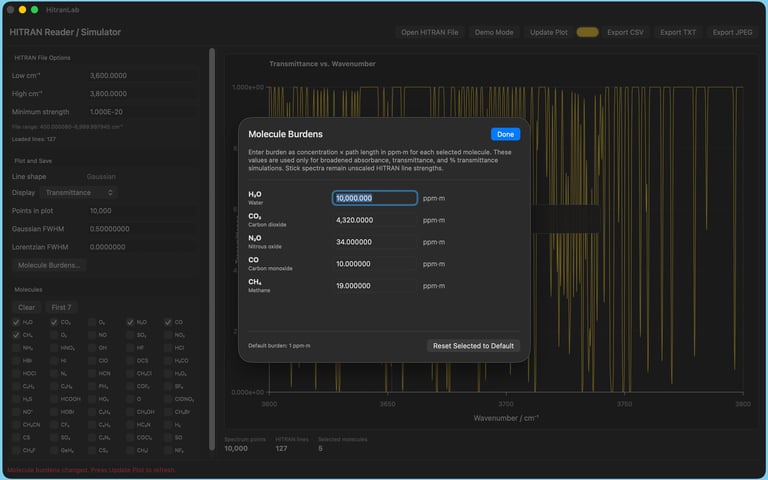
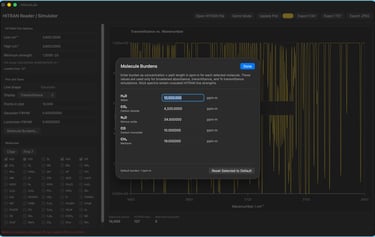
The burden for each molecule can be independently set.
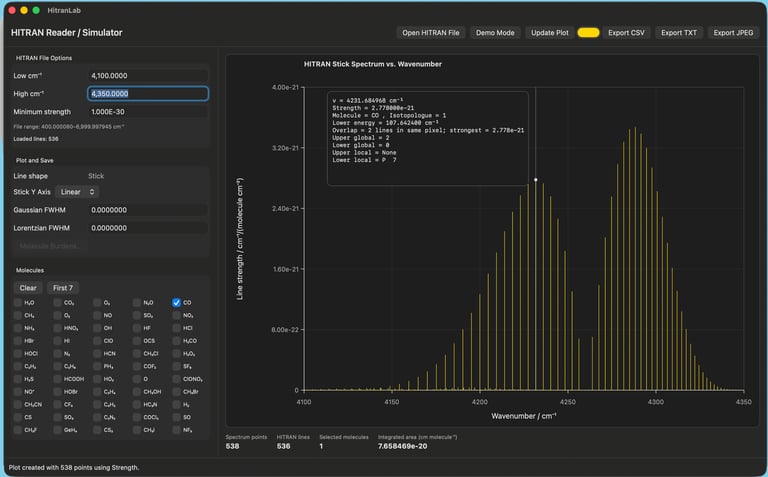
First overtone of CO. In stick mode, the cursor reports line-by-line data, including lower energy value, position, line strength, isotopologue, upper and lower local and global quantum assignments
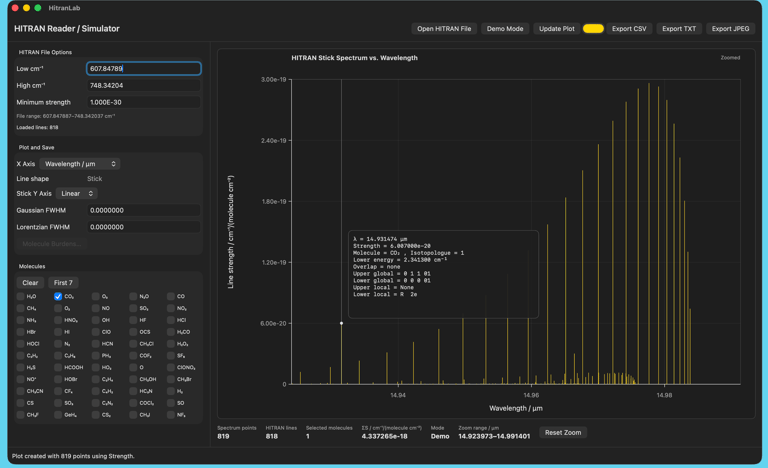
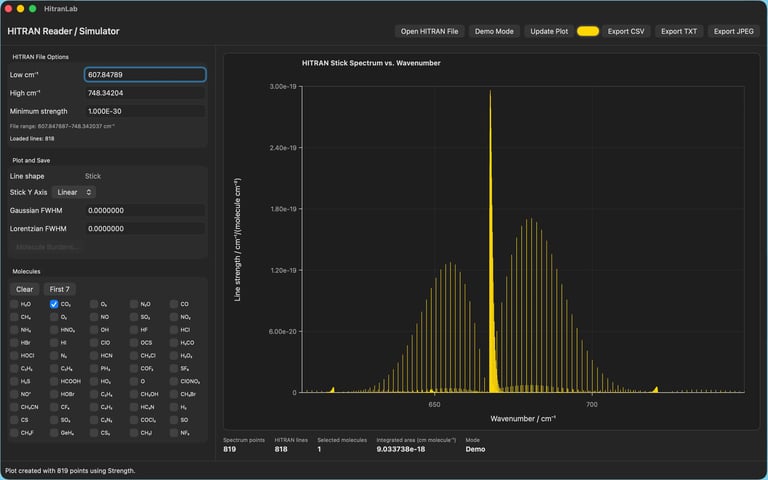


Display x-axis in units of wavenumber (cm⁻¹) or wavelength (μm)
Reach out anytime with questions or feedback at email
© 2026 Steven W. Sharpe. All rights reserved.